


Vital Signs - US [December 2020]
📈📉👨🏻⚕️
I wrote a post looking at some of the macro indicators I like to follow to get a pulse on the economy in June, August, September, and November. This is the December edition.
Why do this?
Human beings have vital signs like pulse rate, respiration rate, body temperature, weight, etc., to make sure everything is functioning correctly. If something is wrong, a combination of those signs or indicators will start deviating from average, raising red flags.
Similarly, economies also have few indicators that serve as vital signs, and monitoring them could give you a sense of an economy's health.
TL;DR version:
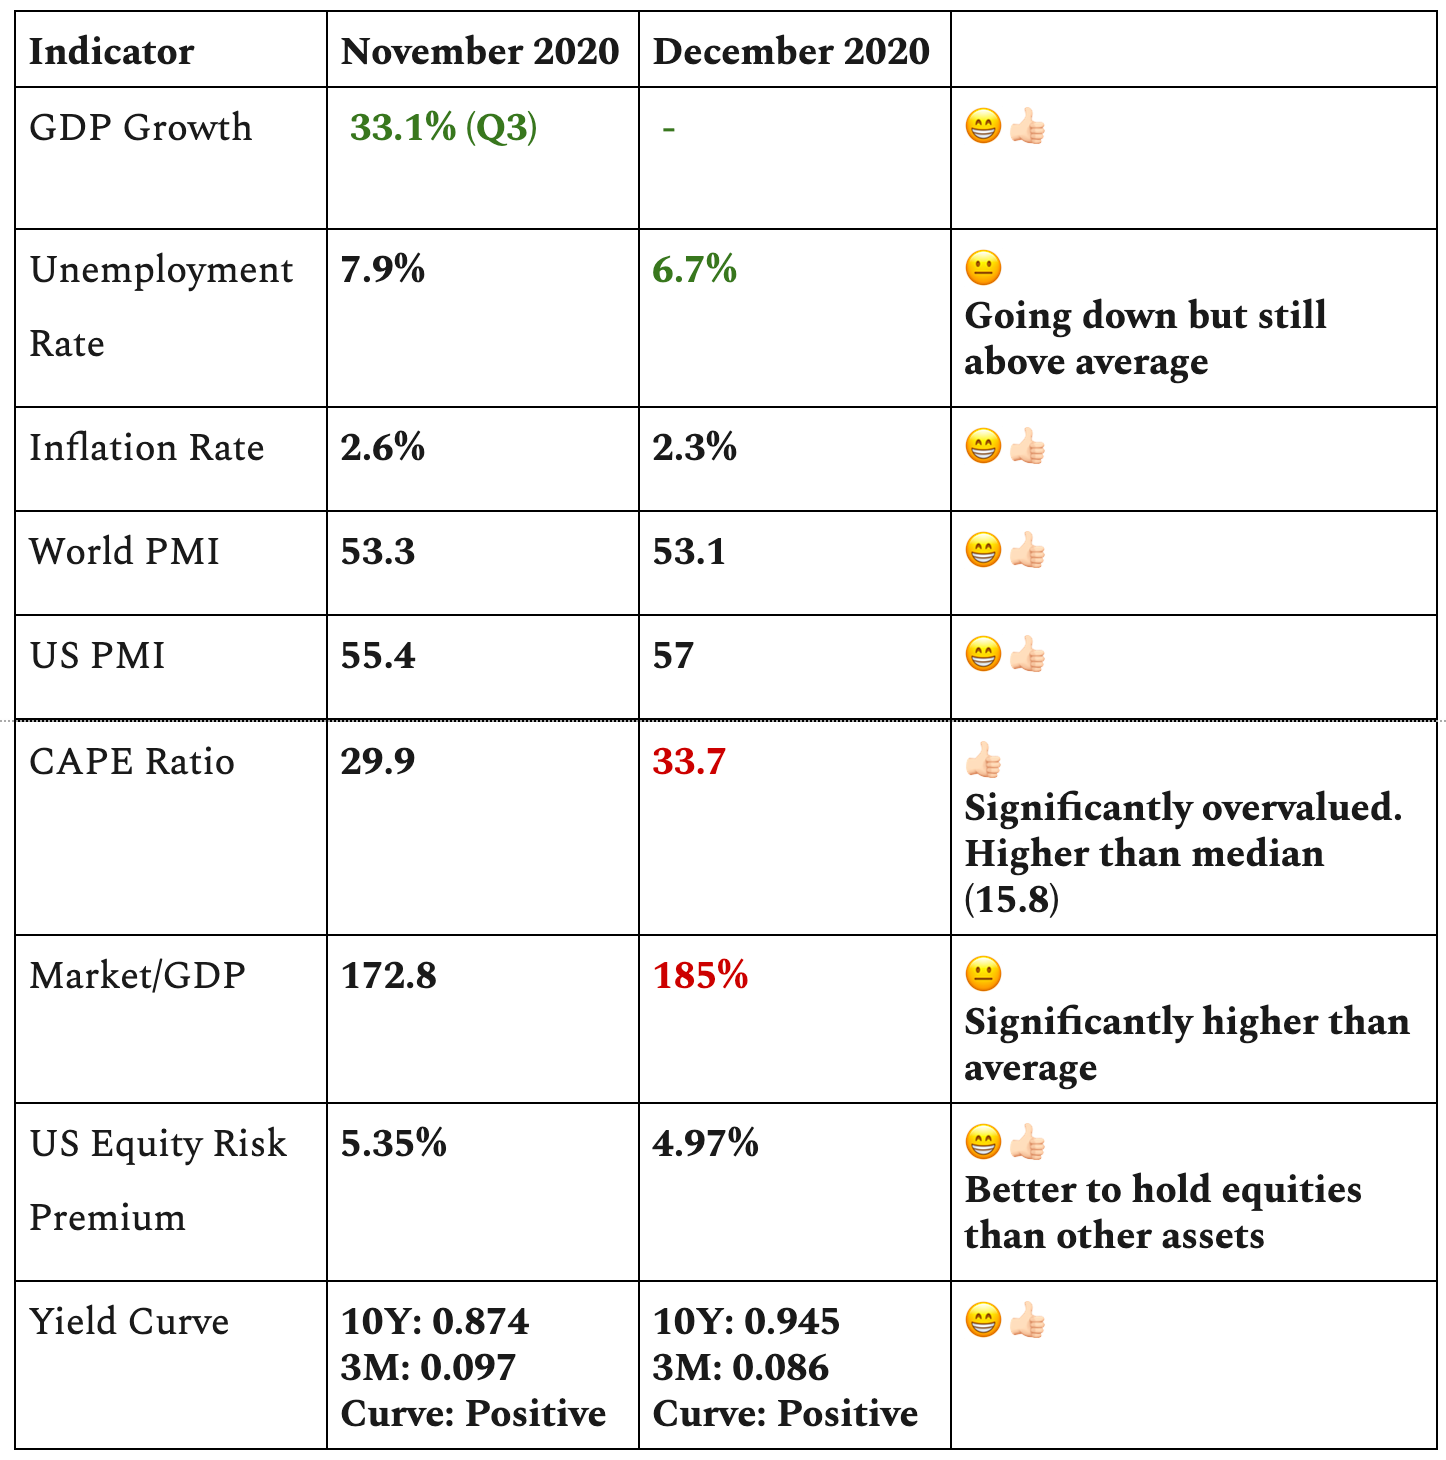
What I’m doing (December 2020):
US GDP has sprung back as businesses and people found a way to keep functioning during the lockdown. Unemployment numbers are headed in the right direction, albeit slowly.
With the US election behind us, there is more certainty for the markets to make decisions on. Historically, a democratic president and a split congress is the best-case scenario for the markets. If you’d like to learn more about how the US election affects the stock markets, we did an entire episode diving deep into it.
Like I said in the last edition of Vital Signs, a lot will depend on the new stimulus package, which Congress is very close to passing. There has been significant progress on the vaccine front as well. Both the US and UK approved the Pfizer vaccine for use. While distribution and instilling trust among the demographics remain challenging, I think this is overall great news—a great win for humanity.
I continue to look for great companies at good prices. While the
US market is overvalued by multiple measures; companies with good business models and huge moats will continue to outperform. I’ve also started buying indexes of Europe, Japan, Turkey, China, and Russia as I think these countries' valuation is very reasonable right now.
Keep reading if you want the details.
Let's begin from the top-
GDP:
Gross Domestic Product (GDP) measures the annualized change in the inflation-adjusted value of all goods and services produced by the economy. It is the broadest measure of economic activity and the primary indicator of the economy's health.
The average growth rate of US GDP over the past five years has been ~2.3%.
The US economy grew by an annualized 33.1 percent in the third quarter of 2020.
Unemployment Rate:
The Unemployment Rate measures the percentage of the total workforce that is unemployed and actively seeking employment during the previous month.
The average unemployment rate in the US in the past three years has been ~4%. It currently stands at 6.7%.
Inflation:
Inflation generally measures the increase in the price of goods.
Average inflation in the past three years has been around 2.6%.
The annual inflation rate in the US currently is 2.3%.
World PMI:
Purchasing Managers' Index (PMI) data are compiled by IHS Markit for more than 40 economies worldwide. The monthly data are derived from surveys of senior executives at private sector companies.
Composite Pmi in World averaged 52.29 points from 2013 until 2020, reaching an all-time high of 55.50 points in July of 2014 and a record low of 26.50 points in April of 2020.
It currently stands at 53.10 points.
US PMI:
Composite Pmi in the United States averaged 53.76 points from 2013 until 2020, reaching an all-time high of 61 points in June of 2014 and a record low of 27 points in April of 2020.
It currently stands at 57 points.
CAPE Ratio:
Price-earnings ratio is based on average inflation-adjusted earnings from the previous 10 years, known as the Cyclically Adjusted PE Ratio (CAPE Ratio), Shiller PE Ratio, or PE 10.
Average: 16.75
Max: 44.1 (Dec 1999)
Current: 33.77
Market/GDP:
The total market valuation is measured by the ratio of total market cap (TMC) to GDP -- the equation representing Warren Buffett's "best single measure."
The lowest point was about 35% in the previous deep recession of 1982, while the highest point was 185% in Dec 2020.

It is currently at 185%, which signals that the market is significantly overvalued.
US Equity Risk Premium:
This is an indicator calculated by NYU Stern Prof Ashwath Damodaran. A high number means that stocks are attractive.
It was lowest in 2000 at ~2% and highest in 2009 at ~6%.
It's currently at 4.97%, which is higher than average.
10Y-3M (Yield Curve):
The 10-year yield for the US treasury is currently at 0.874.
The 3-month yield for the US treasury is currently at 0.097.
The yield curve is calculated as 10Y-3M. Since 10Y > 3M, the yield curve is positive, and that is good for the economy. The negative yield curve is generally a strong leading indicator of a recession.